Table of Content
- Why Traditional Customer Value Metrics Fall Short
- The Five Customer Value Metrics That Measure the New Game
- How These Metrics Work Together
- Putting the Metrics Into Practice
- How evamX Tracks and Acts on Customer Value Metrics
- The Metrics Worth Tracking
Every business tracks customer value. Revenue per user. Churn rate. Net Promoter Score. These numbers appear in every board deck, every quarterly review, every team KPI dashboard.
The problem is not that these metrics are wrong. The problem is that they were designed for a simpler business model, and most businesses have become significantly more complex.
A telecom operator running wallet services, OTT bundles, smart home products, and a partner ecosystem cannot meaningfully evaluate customer health by looking at plan revenue and churn rate alone. A bank offering current accounts, savings products, credit cards, insurance, and investment services cannot understand relationship depth from transaction volume. A retailer with loyalty programs, subscription tiers, marketplace partners, and a mobile app cannot measure customer value through purchase frequency alone.
The metrics that built these businesses are no longer sufficient to grow them. And in most cases, the gap between what the metrics show and what is actually happening in the customer relationship is where the most valuable growth opportunities are hiding.
Why Traditional Customer Value Metrics Fall Short
Traditional customer value metrics share a common design assumption: that the customer relationship is essentially a single product relationship, and that value is a function of how long that relationship lasts and how much the customer pays for it.
This assumption produced metrics like ARPU (average revenue per user), churn rate, customer acquisition cost, and customer lifetime value in its simplest form. These are useful numbers. They are also incomplete.
ARPU hides relationship depth. Two customers with identical ARPU can represent radically different relationships. One holds a single mid-tier plan and has no other interaction with the business. The other holds a basic plan, an active wallet, an OTT subscription, and a smart home service. Both generate the same monthly revenue figure. Only one of them is actually embedded in the business.
Churn rate measures exits, not health. A churn rate of 2% tells you how many customers left last month. It tells you nothing about how many customers are in the early stages of disengagement, how many are holding single-product relationships with no switching cost, or how many are staying out of inertia rather than genuine value. By the time churn rate moves, the relationship quality problem is already months old.
NPS captures sentiment, not behavior. A customer who gives a high NPS score and then churns three months later was not misrepresenting their sentiment. Their relationship quality had simply not yet translated into the behavioral signal that precedes the exit. Sentiment is useful context. It is not a reliable leading indicator of revenue.
The businesses growing fastest in their respective markets have not abandoned these metrics. They have added a second layer: metrics that measure the depth, breadth, and velocity of the customer relationship rather than just its price and duration.
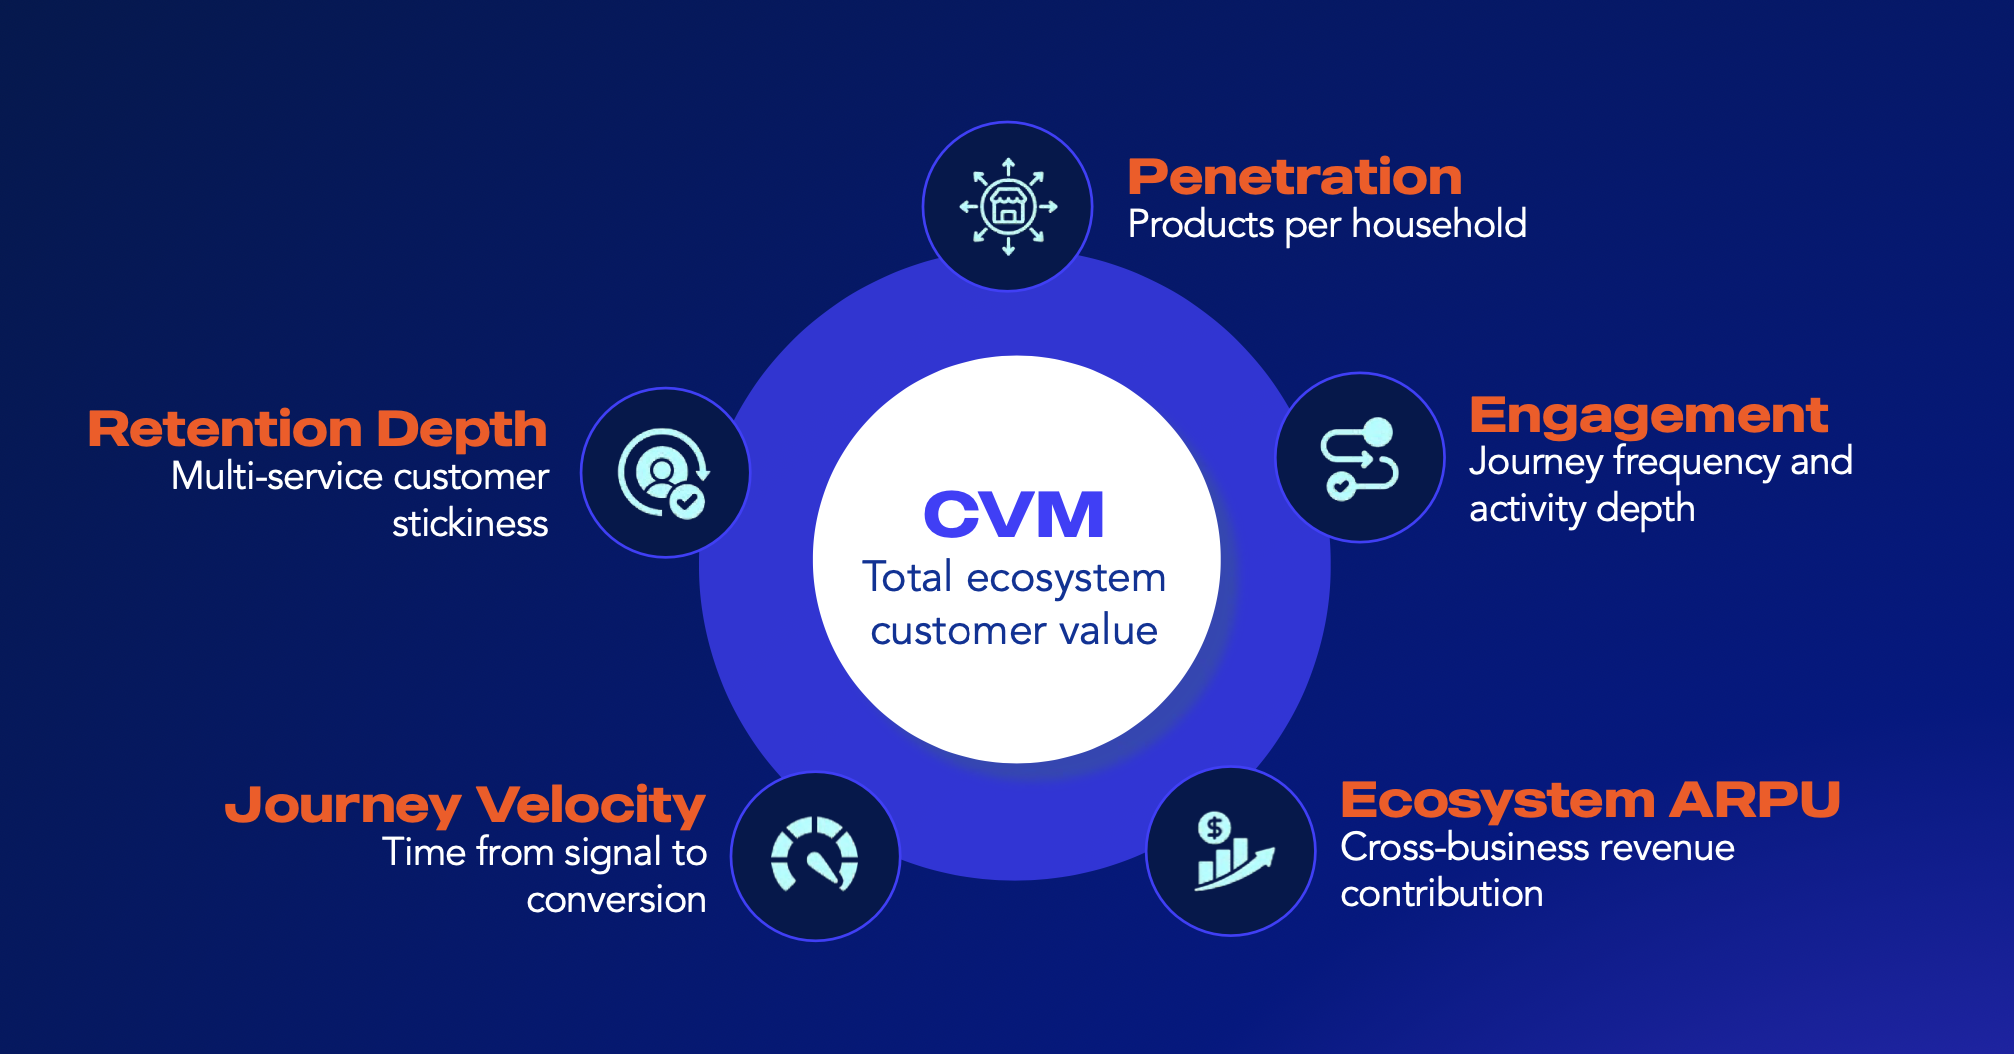
The Five Customer Value Metrics That Measure the New Game
These are the metrics that leading CVM teams, particularly in telecom, banking, and retail, are tracking alongside traditional KPIs to get a complete picture of customer health and growth potential.
1. Ecosystem Product Penetration
What it measures: The average number of products or services a customer holds across the full business ecosystem.
Why it matters: Product penetration is the single strongest predictor of both churn resistance and revenue growth potential. A customer with one product has no switching cost and no embedded relationship. A customer with three or more products across different service categories has built a relationship that is genuinely difficult to replace elsewhere.
The benchmark for leading operators moving toward ecosystem CVM is 3.2 average products per household. This is not an abstract target. It is the level at which churn rates begin to drop structurally, independent of pricing or competitive pressure.
Tracking ecosystem product penetration at the individual customer level also creates the most actionable segmentation in CVM: single-product customers are the highest churn risk and the highest growth opportunity simultaneously. Every journey designed to add a second product to a single-product customer is both a retention play and a revenue expansion play.
2. Ecosystem ARPU
What it measures: Total revenue contribution per customer across all products and services in the ecosystem, not just the primary product.
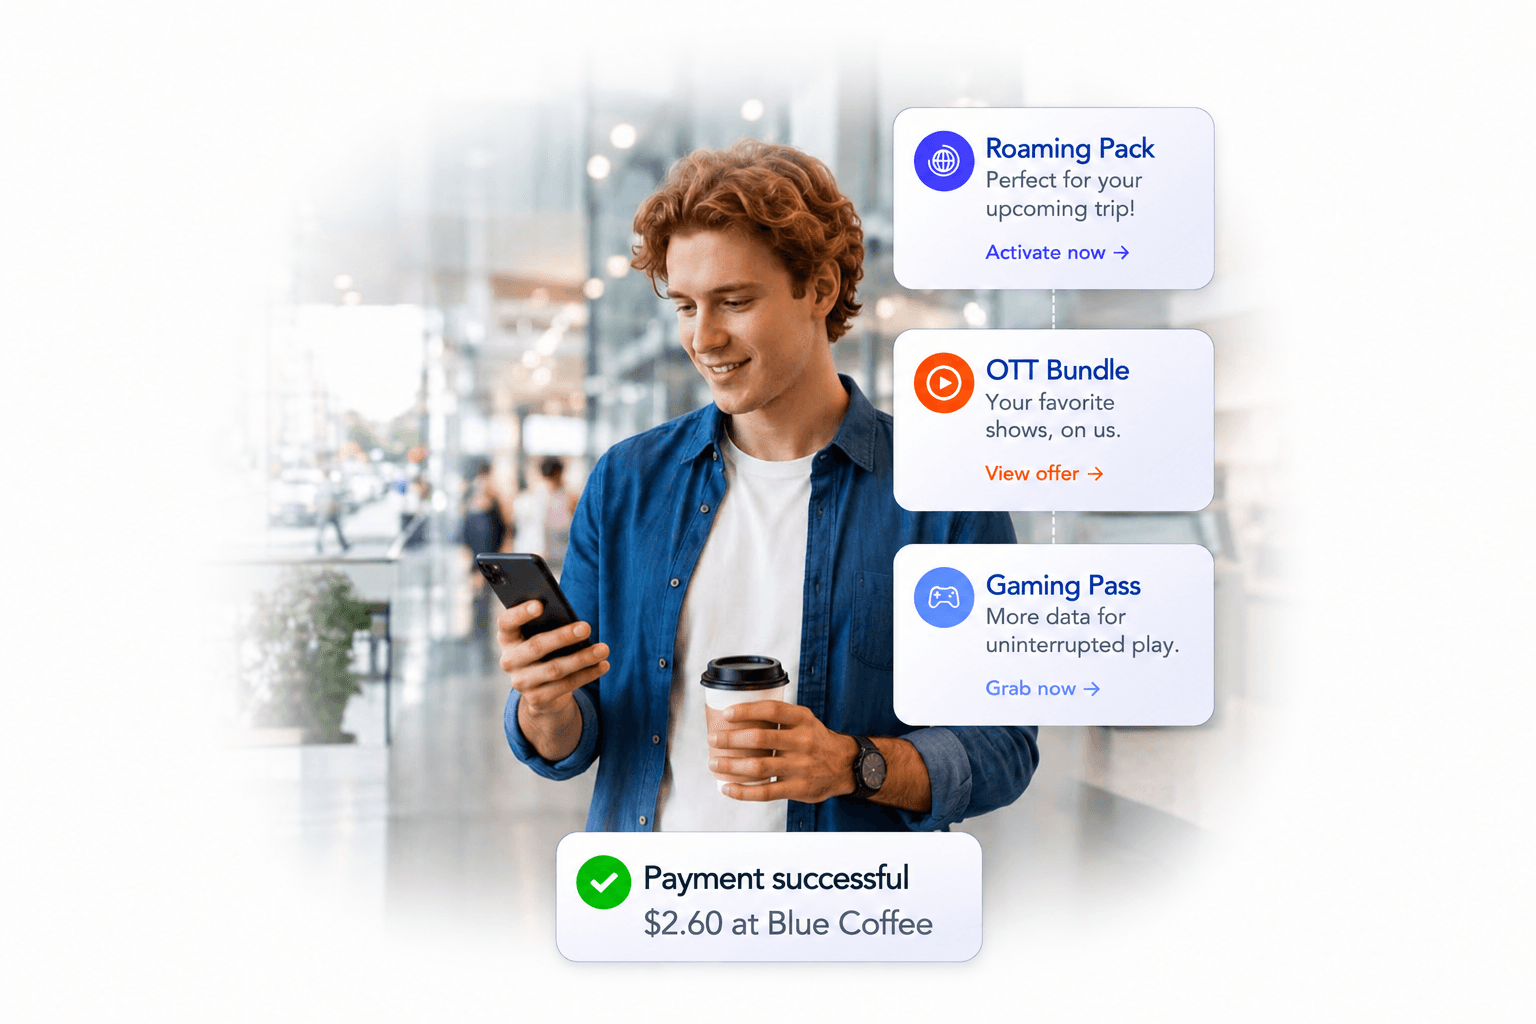
Why it matters: Standard ARPU is a product metric. Ecosystem ARPU is a relationship metric. The difference between a customer generating 20 euros per month on a single connectivity plan and one generating 65 euros across connectivity, wallet, content, and a partner service is not just revenue. It is relationship depth, switching cost, and lifetime value.
Ecosystem ARPU shifts the conversation in CVM from "how do we defend this plan price?" to "how do we grow this customer's total relationship with us?" It also surfaces cross-sell opportunities that product-level ARPU obscures: a high-connectivity-ARPU customer with zero wallet revenue is a clear target for wallet activation, and the data to identify them exists in the ecosystem ARPU breakdown.
Cross-business revenue contribution typically runs at 2 to 4 times higher for customers in mature ecosystem relationships compared to those in single-product ones. The gap between a business's average ARPU and its ecosystem ARPU ceiling is one of the most useful ways to quantify the growth opportunity that traditional metrics never surface.
3. Retention Depth
What it measures: The degree to which a customer's relationship is embedded across multiple services, creating structural switching cost independent of contract terms or pricing.
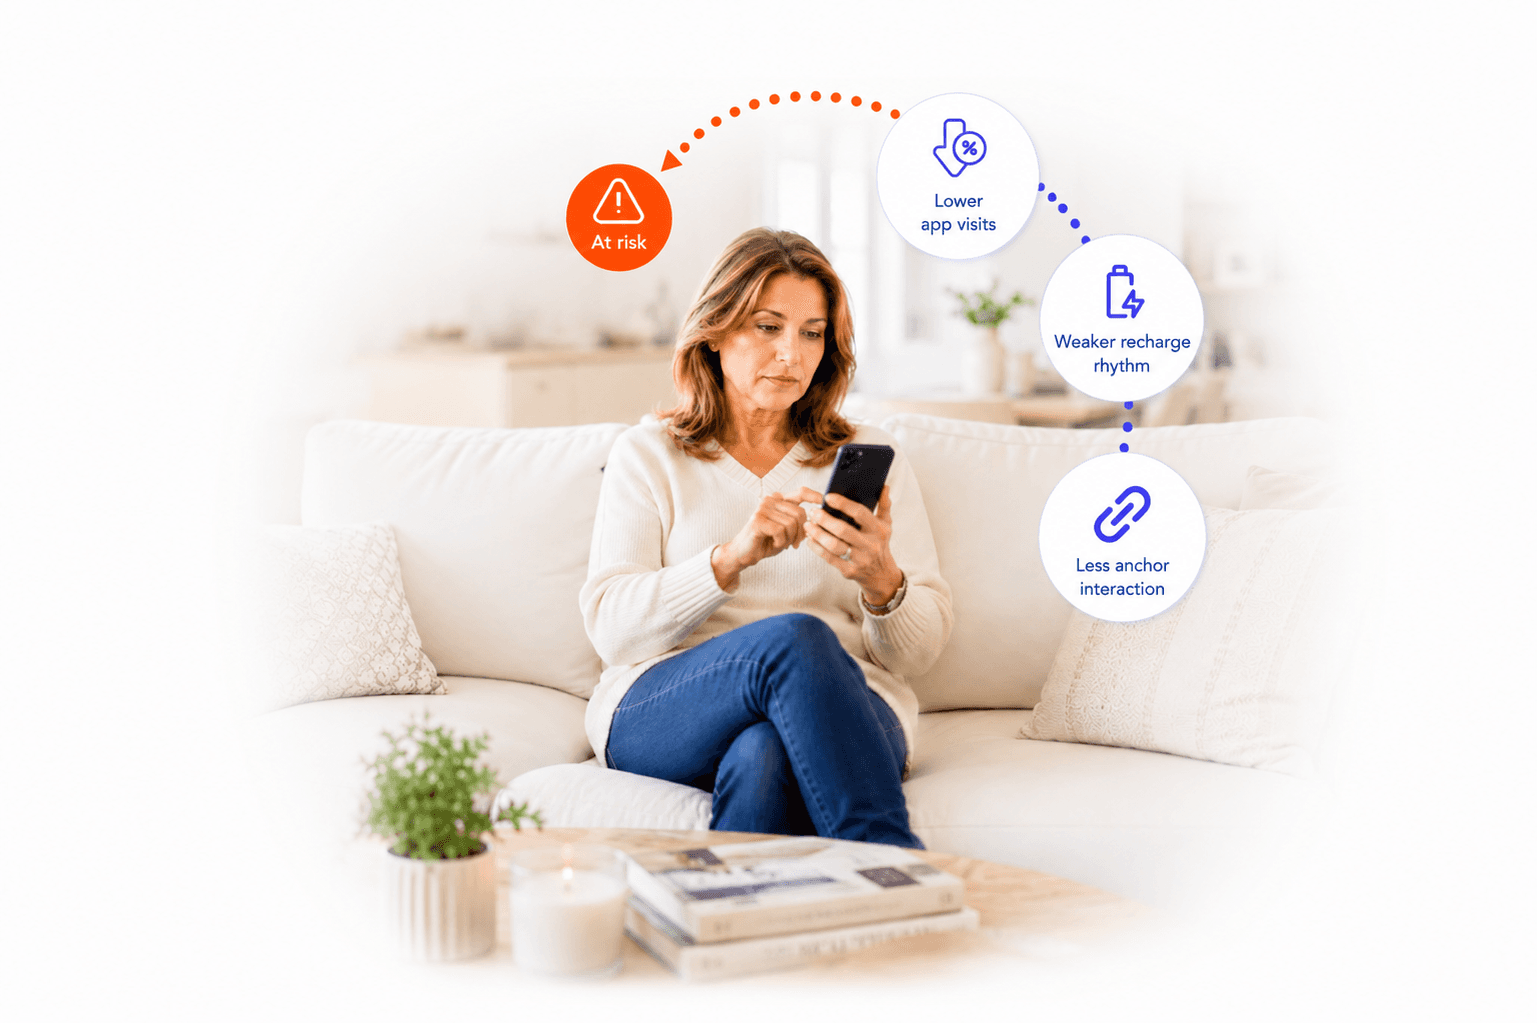
Why it matters: Churn rate tells you who left. Retention depth tells you who is genuinely at risk of leaving, and who is unlikely to leave regardless of what competitors do.
A customer on a 12-month contract has contractual retention. A customer with mobile, broadband, wallet, and OTT services embedded in their daily life has structural retention. When the contract expires, the contractually retained customer evaluates. The structurally retained customer has too much to move.
Retention depth is measured as a composite of product count, service usage frequency, cross-category engagement, and ecosystem anchor strength. Businesses that track retention depth consistently report the same finding: customers with high retention depth churn at 30 to 40 percent lower rates than those with equivalent ARPU but low depth scores. The revenue implication is significant. The churn intervention cost implication is even more significant.
4. Journey Velocity
What it measures: The time elapsed between detecting a customer signal and successfully delivering a relevant action that moves the customer relationship forward.
Why it matters: Journey velocity is the metric that most directly captures the operational effectiveness of a real-time CVM system. It answers the question: when a customer signal fires, how quickly does the business respond in a way that actually influences the customer?
In a batch-based CVM environment, journey velocity is measured in days. A behavioral signal detected on Monday enters a campaign planning cycle, appears in a segment update by Wednesday, and reaches the customer in a scheduled send on Thursday or Friday. By that point, the intent that generated the signal has often resolved itself, one way or another.
In a real-time CVM environment, journey velocity is measured in milliseconds for automated journeys and hours for complex multi-step sequences. The business impact of this difference is measurable and consistent: real-time intervention on high-intent signals converts at 3 to 5 times the rate of the same intervention delivered 24 hours later.
Journey velocity is also the metric that most clearly exposes the cost of IT dependency in CVM operations. A team that needs to submit an engineering ticket to update a suppression rule or launch a new trigger journey is operating at a journey velocity measured in weeks, regardless of how sophisticated the underlying technology is.
5. Wallet Usage Frequency
What it measures: For businesses running embedded financial services or wallet products, the average number of transactions per active wallet user per month.
Why it matters: Wallet usage frequency is the deepest available signal of ecosystem engagement for operators running financial services alongside connectivity or retail. A customer who uses a wallet once at activation and never again is technically an active wallet user. A customer who uses it 8 to 10 times per month for bill payments, merchant transactions, peer transfers, and rewards redemption has embedded the financial relationship into their daily financial life.
The benchmark for high-engagement wallet ecosystems is 8.7 transactions per active user per month. Below that threshold, wallet adoption is nominal. Above it, the financial relationship is genuinely embedded, and the cross-sell opportunity into adjacent products, including insurance, credit, and investment services, becomes significantly more accessible.
Wallet usage frequency also correlates strongly with overall ecosystem depth: customers who use a wallet actively tend to engage more across other services, generate stronger behavioral signals, and churn at lower rates. It functions as both a measure of financial relationship health and a leading indicator of overall ecosystem engagement.
How These Metrics Work Together
These five metrics are most useful not in isolation but as a system that describes customer relationship health from multiple angles simultaneously.
Ecosystem product penetration and ecosystem ARPU describe the breadth and revenue depth of the relationship. Retention depth describes its structural durability. Journey velocity describes how effectively the CVM system is responding to opportunities to strengthen it. Wallet usage frequency describes the depth of the financial layer within it.
A customer with high product penetration, high ecosystem ARPU, high retention depth, and high wallet usage frequency is the most valuable customer in the base. A customer with low product penetration, standard ARPU, low retention depth, and no wallet engagement is both the highest churn risk and the highest growth opportunity. The CVM strategy for each is completely different, and traditional metrics would not distinguish them at all.
Cross-category conversion rates sit alongside these five as a useful operational metric: the percentage of customers who move from one service to an adjacent one through an orchestrated journey. Leading operators with mature real-time CVM capabilities run at 18 to 27 percent on this metric. Those still operating on batch logic run at 5 to 8 percent. The gap represents the revenue that journey velocity is either capturing or leaving behind.
Putting the Metrics Into Practice
Tracking better metrics only creates value when the operational system can act on what they reveal.
Ecosystem product penetration identifies the single-product customers who are both at risk and ready for expansion. Journey velocity determines whether the CVM system can reach them in time. Retention depth tells the team which customers need a second anchor product before they reach the reactive churn threshold. Ecosystem ARPU shows which customers have room to grow and which are already close to their relationship ceiling.
The businesses that use these metrics most effectively are those that have connected them to real-time decisioning: each metric feeds a trigger, a suppression rule, or an offer eligibility criterion. A customer whose wallet usage frequency drops below a threshold enters a re-engagement journey. A customer whose product penetration has been static for 90 days enters an ecosystem expansion journey. A customer whose retention depth score falls below a benchmark triggers a proactive intervention before any traditional churn model would flag them.
This is what customer value metrics look like when they are genuinely operational rather than just reportable: not numbers that appear in a quarterly review, but signals that drive real-time decisions in the customer relationship.
How evamX Tracks and Acts on Customer Value Metrics
evamX is built around the architecture that makes these metrics operational rather than just descriptive. Every customer interaction generates a signal that updates the customer's ecosystem profile in real time: product penetration score, ecosystem ARPU contribution, retention depth composite, wallet usage frequency, and journey velocity across active sequences.
The NBX decisioning engine evaluates these metrics at the moment of each customer interaction, using them as inputs into offer eligibility, action prioritization, and suppression logic. A customer's current retention depth score influences which journey they enter. Their ecosystem ARPU gap determines which cross-sell offers are surfaced. Their journey velocity history informs the timing and channel of the next interaction.
For CVM and analytics teams, Insight Tracker provides real-time visibility into these metrics at the individual, segment, and portfolio level, with the ability to drill from aggregate trends to individual customer journeys. Teams can see which journeys are improving ecosystem product penetration, which are lifting wallet usage frequency, and which are failing to convert within the journey velocity window, and adjust without waiting for a monthly report cycle.
Across telecom, banking, and retail, organizations running ecosystem CVM with evamX consistently report the same shift in how these metrics move: product penetration rises as wallet activation and convergence journeys compound. Ecosystem ARPU follows. Retention depth improves as customers accumulate more services. Journey velocity decreases as automation handles more of the real-time decisioning work. And churn rate, the traditional lagging indicator, eventually reflects the structural health that the leading metrics have been building for months.

The Metrics Worth Tracking
Customer value metrics are not an academic exercise. They are the operational foundation of a CVM strategy, and the metrics a team tracks determine what it optimizes for.
Single-product KPIs optimize for single-product outcomes: plan revenue, contract renewal, and reactive retention. Ecosystem metrics optimize for relationship depth, cross-service growth, and structural churn resistance.
The businesses that make the shift do not abandon their traditional metrics. They add the ecosystem layer alongside them, and over time, the ecosystem metrics become the leading indicators that drive the decisions, while the traditional metrics become the lagging confirmation that the strategy is working.
That shift, from measuring what happened to measuring what is happening and what is likely to happen next, is what modern customer value metrics are actually for.