
 Evo AI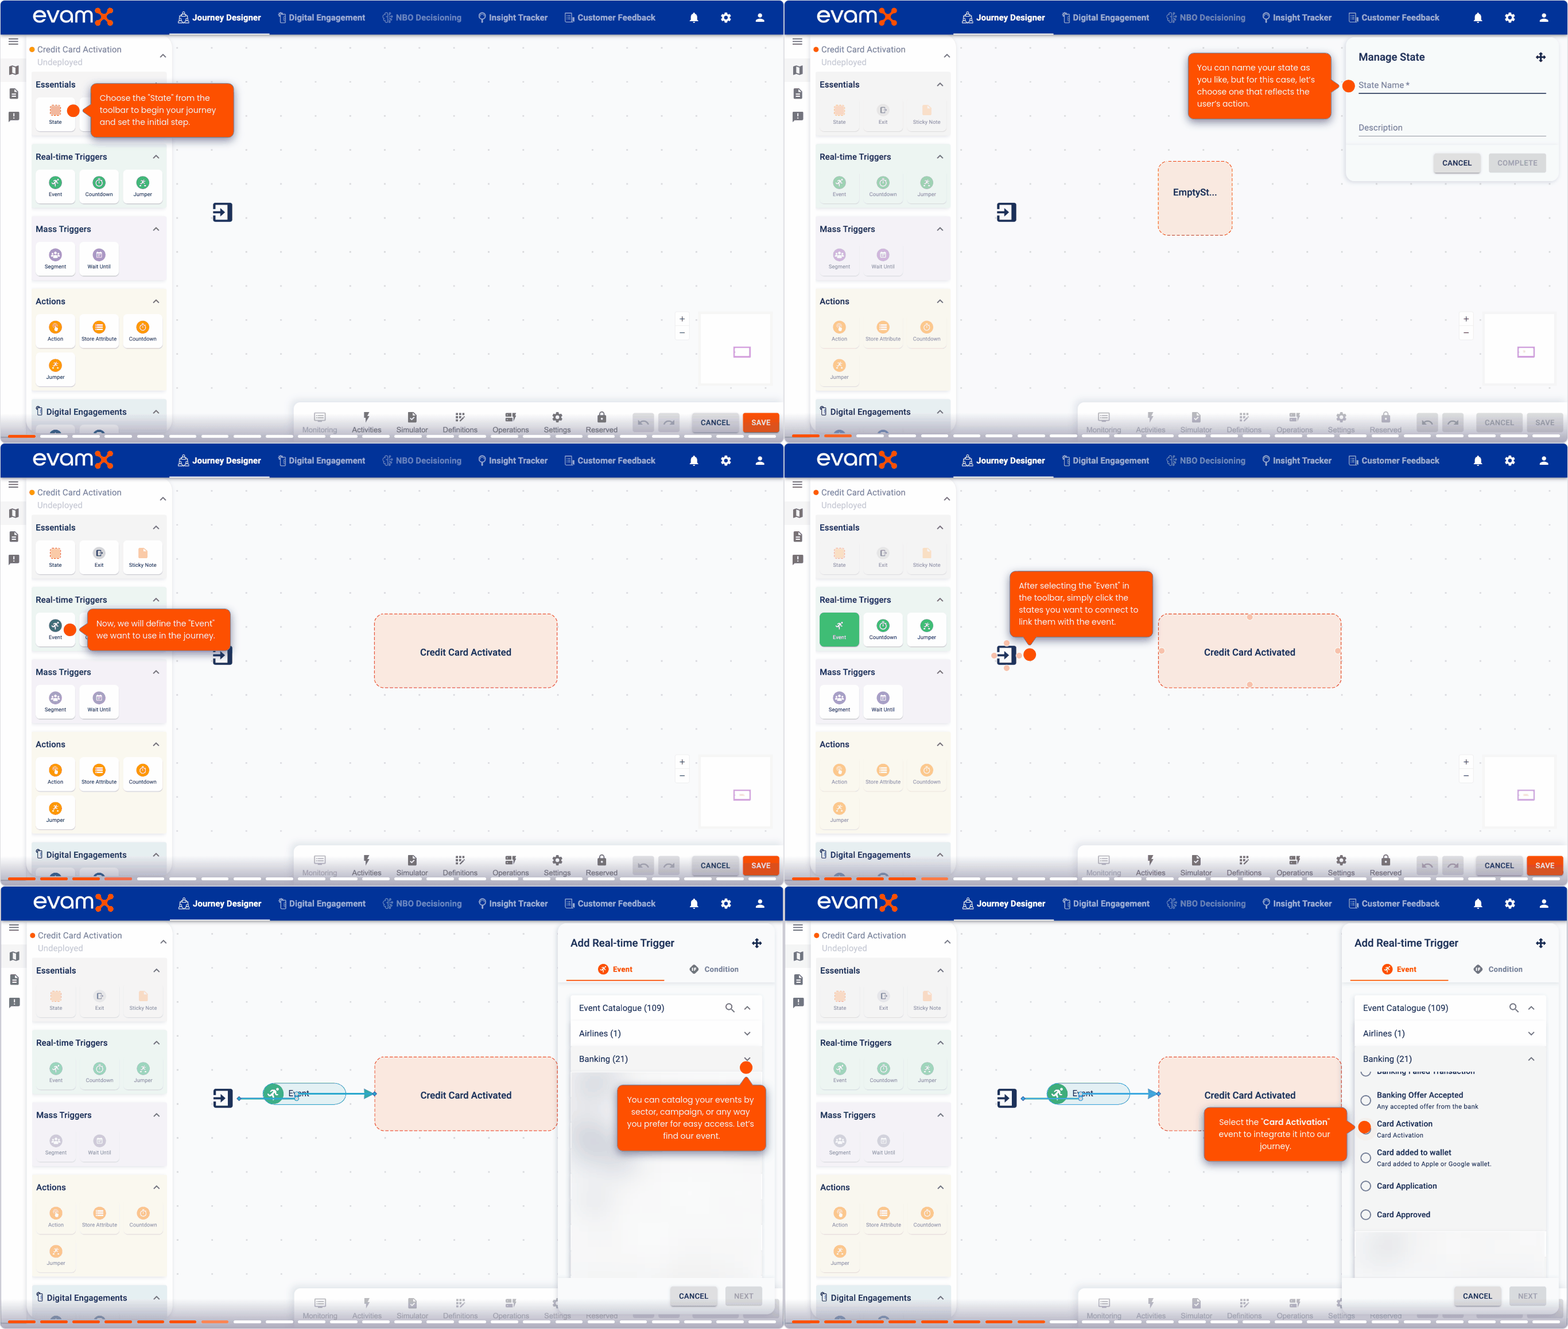
Share Post
Table of Contents
- The KPI Trap: Measuring Everything, Understanding Nothing
- The Metrics That Actually Predict Behavior
- Where Measurement Usually Breaks Down
- Turning Measurement Into a System
- Benchmarks Worth Comparing Against
- How evamX Powers App Engagement Measurement


Summarize with AI


A telecom company launches a data top-up reminder campaign. The report comes back strong: 35 percent open rate, 8 percent click-through, 2,500 completed top-ups. The team celebrates, and budget gets approved for next quarter.
Six months later, someone asks whether those customers actually stayed longer, or churned anyway. Nobody tracked it.
This is the trap most mobile teams fall into. Opens, clicks, and downloads are easy to measure, so they become the measurement. Whether any of it kept a customer around, or made them more valuable, gets asked later, if it gets asked at all. In telecom, banking, and retail, the app isn't a feature anymore, it's the front door to the relationship, and reporting on activity without connecting it to outcomes is close to measuring nothing at all.
The KPI Trap: Measuring Everything, Understanding Nothing
Most KPI lists try to solve this by adding more metrics. That makes the problem worse, not better. The goal isn't tracking sixteen numbers. It's understanding a handful of them deeply enough to know what they're actually telling you.
Active users are the starting point, not the answer. Daily and monthly active users tell you whether people are opening the app at all, but the raw number means little without context. A banking app with a million downloads and fifty thousand daily active users has a real problem, but a retail app might show a lower ratio simply because shopping is seasonal, while a banking app checks-balance behavior naturally runs higher. What matters is not the number itself but its trend: is it growing, flat, or sliding, and does that match what the business actually needs from the app.
Retention is where the honest story lives. Downloads and active-user counts can look healthy while retention quietly falls apart underneath them. Most apps see steep early drop-off, a large share of first-time users never return after day one, and only a small fraction remain by day ninety. Apps that treat onboarding as a real product problem, not a formality, consistently shift that curve, and across millions of users even a modest improvement in day-thirty retention compounds into a meaningfully different business.
Session frequency and length reveal habit, not just activity. How often someone opens the app, and how long they stay once they do, says more about whether the app has become part of a routine than any single vanity metric. The right benchmark depends entirely on the app category: a banking app is healthy with short, frequent sessions, while a retail app is healthy with longer, less frequent ones. Optimizing for time spent without asking whether that time is meaningful just produces a different vanity metric.
Where Measurement Usually Breaks Down
A few patterns show up repeatedly in teams that measure a lot and still get surprised by churn.
Vanity metrics get celebrated while the foundation cracks. A download milestone is easy to put in a slide. It says nothing about whether those users ever came back. Teams that optimize acquisition campaigns without connecting them to retention outcomes can spend months, and real budget, driving installs that never translate into engaged customers, and often don't notice until a cohort analysis finally connects the source of a customer to how long they stayed.
Campaign metrics get confused with customer impact. A high click-through rate on a push notification feels like success, but a click is not a conversion, and a conversion is not retention. It's possible for a well-performing campaign, by its own metrics, to be driving customers who click, get frustrated by what happens next, and leave sooner because of the experience, not despite the click-through rate. The fix is tying every campaign to what happens after the click: completed actions, renewals, and whether the customer is still active weeks later.
Early warning signs get ignored until it's too late. Churn rarely happens without warning. Session frequency drops below a customer's own baseline, engagement with core features plateaus, response rates to campaigns decline. These signals are detectable well before a customer actually leaves, but most organizations only look at churn after it has already happened, which turns retention into crisis management instead of prevention.
Engagement gets treated as a campaign instead of a system. A single well-timed campaign can perform well for a while and then decay, because customer behavior shifts and the message doesn't. Engagement that holds up over time comes from triggers based on behavior rather than a calendar, personalization that evolves as new data comes in, and measurement against cohorts and patterns rather than one aggregate number that hides what's actually happening underneath it.
Turning Measurement Into a System
The shift that actually matters is moving from reporting on engagement to building measurement into the customer journey itself.
Consider a bank redesigning a loan application flow. Instead of asking only whether people completed the application, it can measure each step separately: how many started, how many made it through identity verification, how many completed the full application, and how many of those customers stayed active months later. That kind of step-by-step view can reveal, for instance, that a large share of drop-off happens at one specific friction point, identity verification, rather than being spread evenly across the funnel, which points to a fixable product problem rather than a vague acquisition issue.
The same logic applies to churn prediction. A customer whose session frequency drops meaningfully below their own historical baseline is showing a real signal, even before any single threshold is breached. Systems built to notice that shift and trigger a relevant response, a helpful nudge, a win-back offer, at the moment the pattern appears, catch customers while the relationship is still recoverable, instead of after they've already decided to leave.
Segmentation matters just as much as timing. A single blended retention number can hide very different realities underneath it. Customers acquired through referrals often behave nothing like customers acquired through paid acquisition. High-value customers churn for different reasons than low-value ones, and respond to different kinds of outreach. Measuring engagement by segment, rather than as one company-wide average, is usually what reveals which lever is actually worth pulling.
Benchmarks Worth Comparing Against
Knowing whether a number is good requires knowing what good looks like. Realistic ranges vary by category, but as a general reference: day-one retention in the 25 to 35 percent range is typical, with strong onboarding pushing that above 40 percent. Day-thirty retention in the 5 to 15 percent range is common, with best-in-class apps reaching 20 percent or higher. A DAU to MAU ratio of 20 to 30 percent is generally healthy, with anything above 40 percent considered strong engagement. Push notification opt-in rates typically fall between 50 and 70 percent, with open rates in the 5 to 10 percent range and top performers reaching into the high teens.
The number itself matters less than the direction it's moving. A benchmark tells you where you stand. It doesn't tell you whether the trend line is the one you want.
How evamX Powers App Engagement Measurement
Most measurement stacks separate analytics from action: a dashboard shows what happened, and a different team, on a different schedule, decides what to do about it. evamX is built to close that gap, combining real-time event tracking, behavioral prediction, and journey orchestration into a single system instead of a report that someone has to act on manually.
evamX captures engagement signals as they happen, a session frequency drop, a stalled onboarding flow, a declining response rate, and evaluates each one against the customer's full context rather than waiting for the next scheduled analysis. When a signal crosses a meaningful threshold, evamX can trigger a response immediately through whichever channel the customer is already in, push, in-app, SMS, or email, and continue adjusting timing and messaging based on what actually works for that segment, not a single static rule applied to everyone.
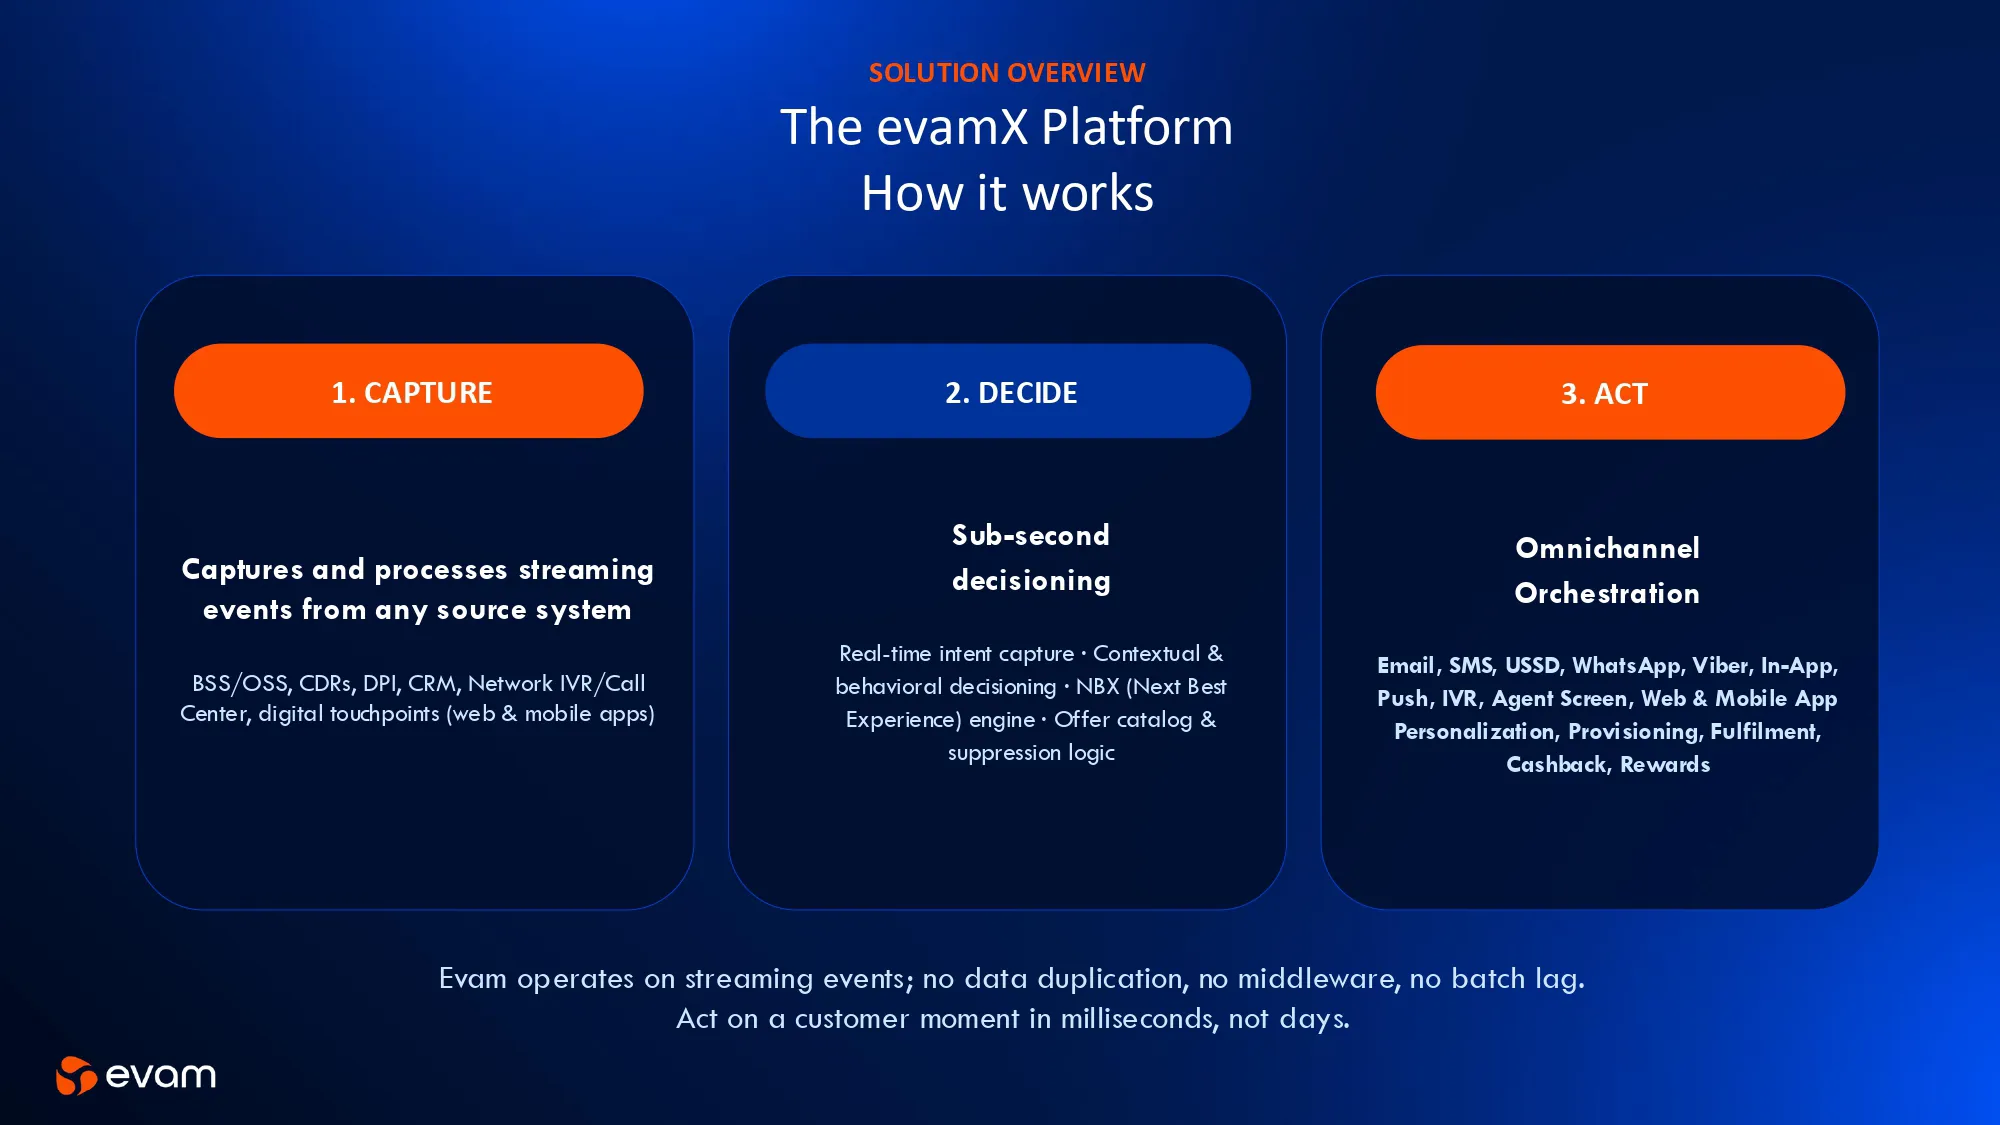
For a telecom operator, that might mean detecting a low data balance, weighing the likelihood that a given customer is at risk of churning, and delivering a personalized top-up reminder at the moment it's most likely to land, then tracking whether it converted and feeding that outcome back into the next decision. That loop, capture, decide, act, and learn, running continuously across millions of customers, is the actual difference between measuring engagement and building it as a system.
If you want to see what this looks like against your own engagement data, our team is glad to walk through it with you. Reach out through our contact page.